
Your cameras can be online, recording, and still produce unusable video. AI Image Analysis adds a new layer of health...

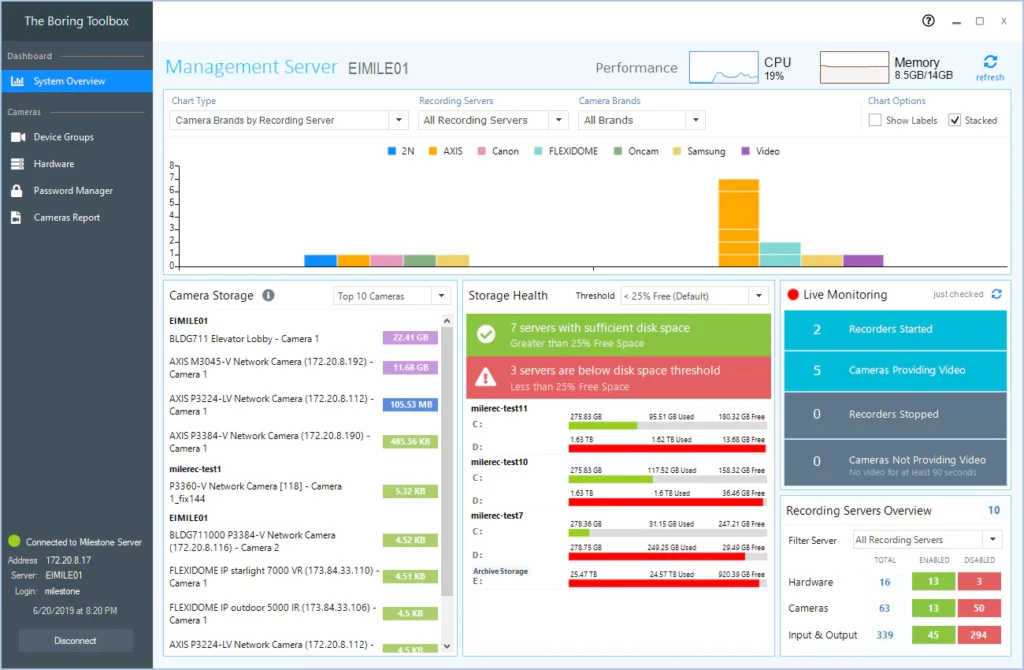
This is not meant to be a full SNMP monitoring package, there are plenty of those to choose from, the Boring dashboard is meant to be a simple to use, pane of information that bubbles up system statistics that will actually mean something to a Milestone XProtect administrator. To come up with the charts and tiles we reflected on our history of installing and maintaining Milestone systems and came up with what we believe are going to be the most useful pieces of information but we would love your feedback!
Most of the dashboard revolves around the recording servers but here we are wanted a simple view of the CPU and memory usage of the management server.

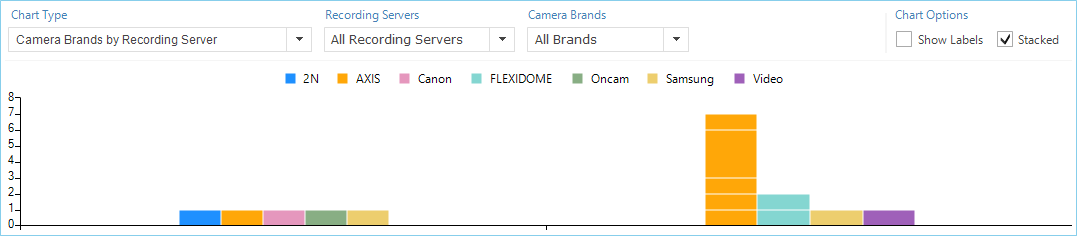
The dashboard is broken up into two main sections, charts and tiles. The charts are on the upper half of the window and tiles below. The charts are filterable graphs which provide a high level overview of the entire surveillance system. Additional details can be gained by hovering the mouse over the bars in the chart.
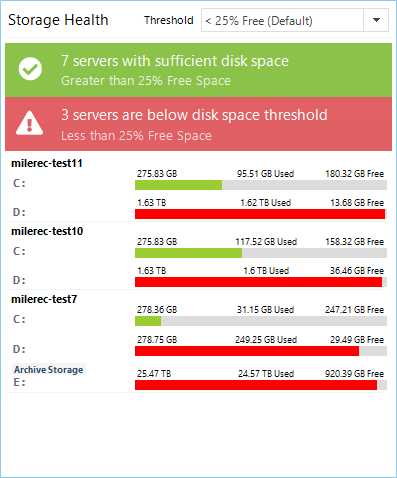
This chart will show used/free space on OS and LIVE video database drives only.
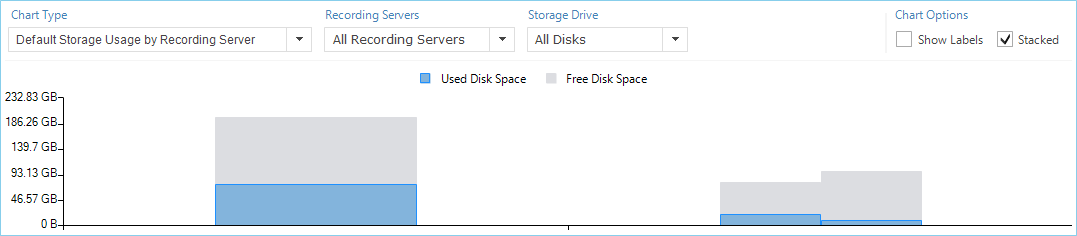
This chart will show used/free space of drives designated for video archives, including NAS/SAN drives
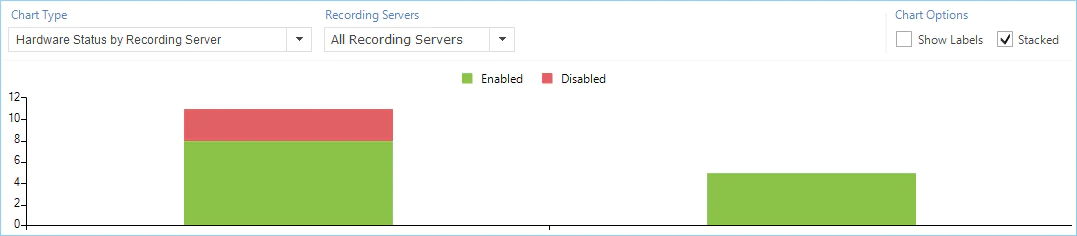
This chart will show the number of hardware devices that are enabled/disabled on each recording server. This is great for planning and load-balancing.
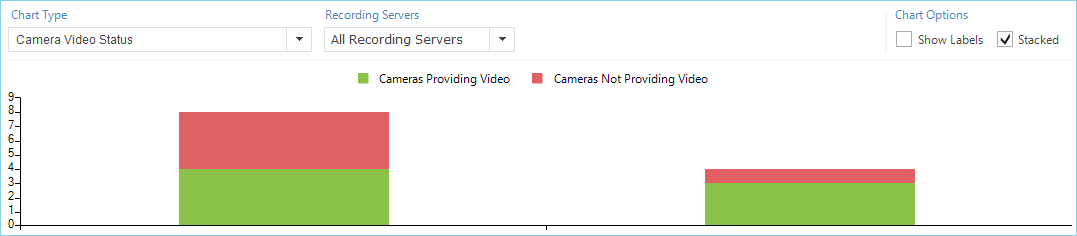
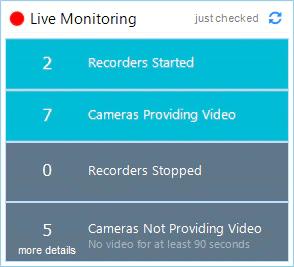
This chart will show the number of cameras that are providing an image to Milestone and those that have not provided an image for at least 90 seconds. These cameras can still be online and pinging but are for some reason Milestone can not pull video from the camera and is therefore not recording.
This chart shows the quantity of each camera by manufacturer and model per recording server. This chart is great for systems that are under transition from one camera brand to another or one technology to another. Imagine a large system transitioning from encoders to IP cameras. This chart will help you quickly see where you are in the transition per recording server and how to plan.
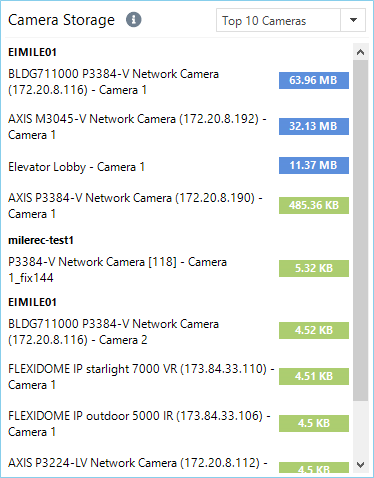
Dashboard tiles are more detailed views of the system and provide more actionable data.
This is a top 10 to 50 cameras using the most storage. This is used to quickly identify defective cameras, cameras with unexpected constant motion (read: spiders and other insects) and those that might need to have motion adjusted.
This tile provides an at-a-glance view of the recording servers and their storage health.
This tile provides greater detail on the video and recording server availability. We monitor the four items below:
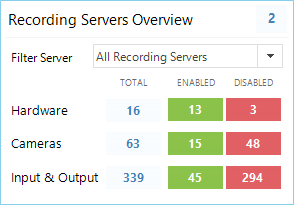
Provides a quick reference on the number of hardware, devices and IO devices are enabled on the system as a whole or per recording server.
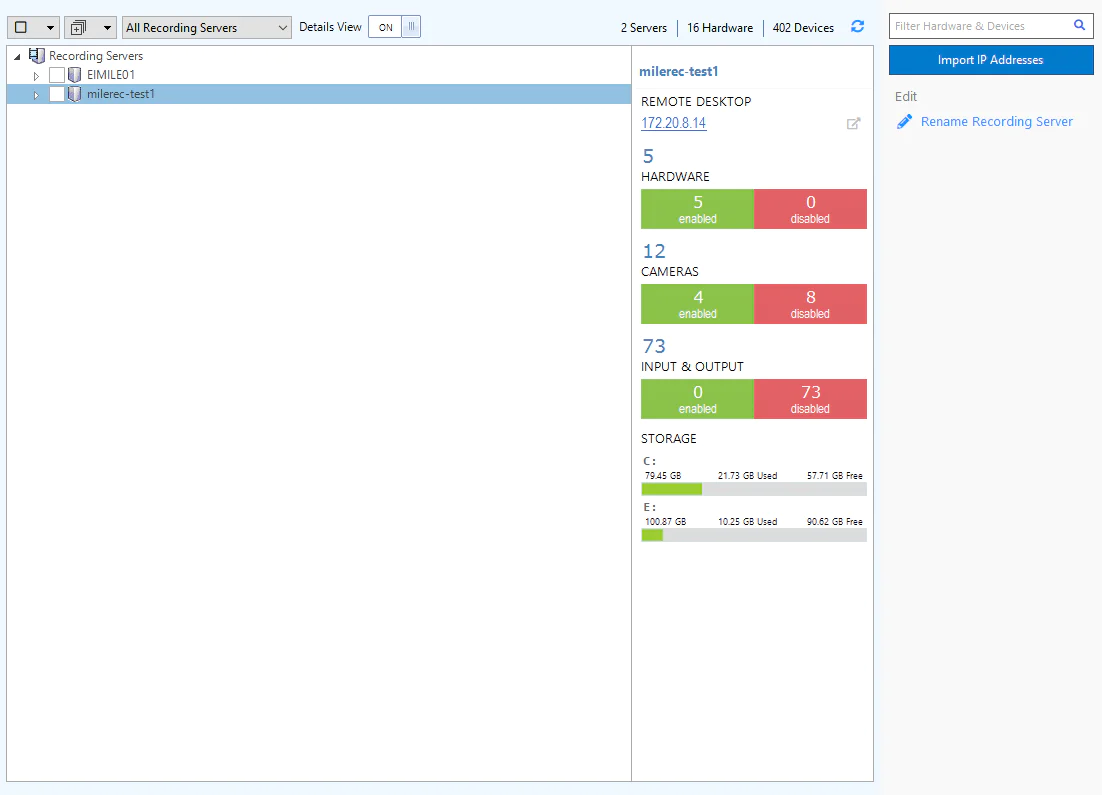
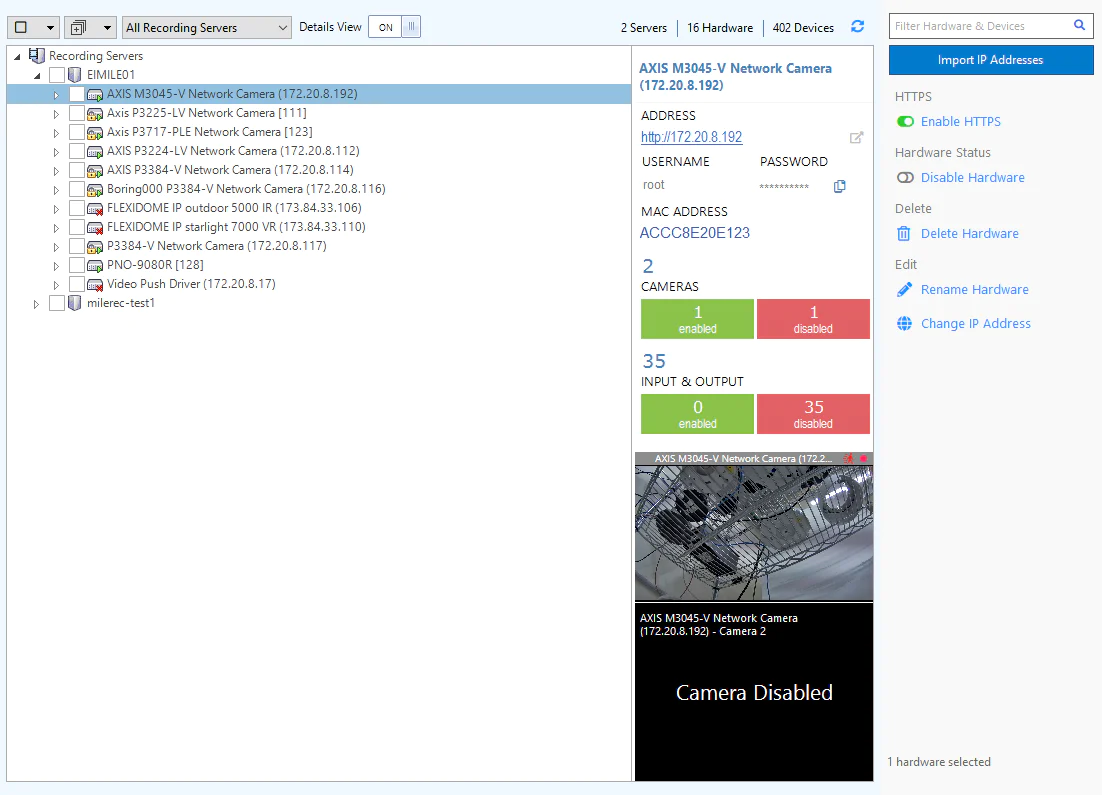
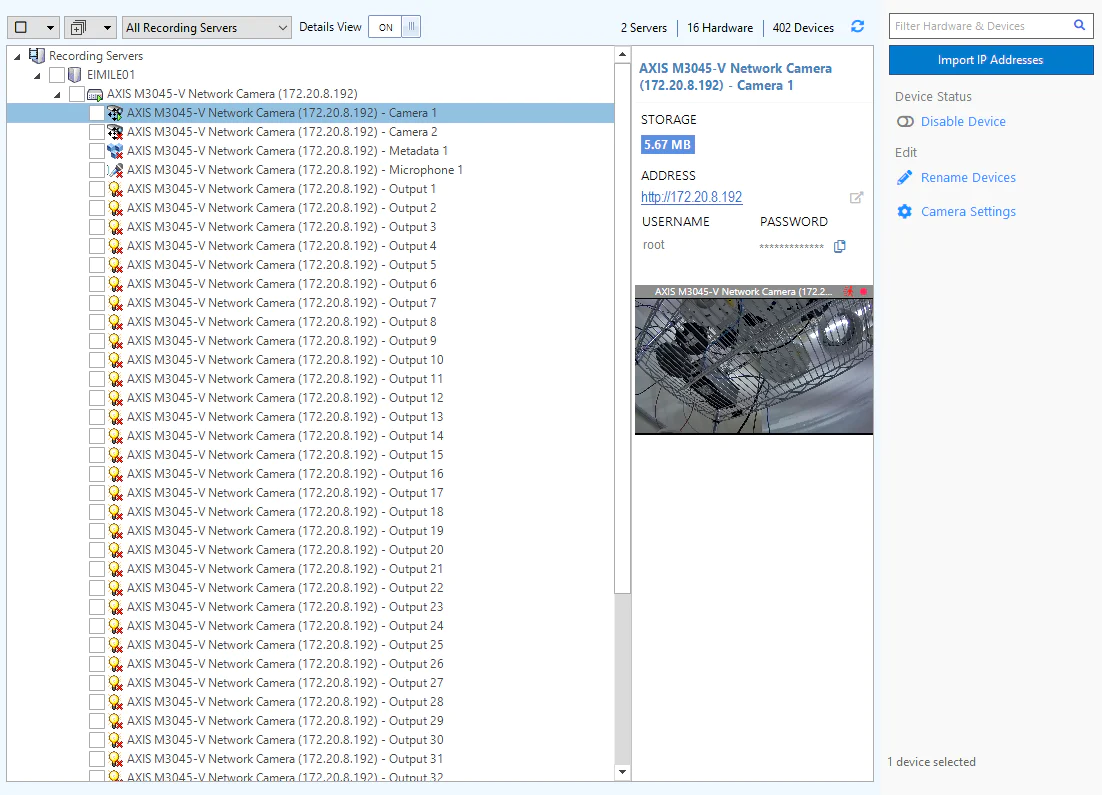
Hardware details provides greater context for recording servers, hardware and devices on the Milestone VMS. Additional context will show when the item is highlighted via a grey bar. This selection is independent of the check-boxes found next recording servers, hardware and devices.
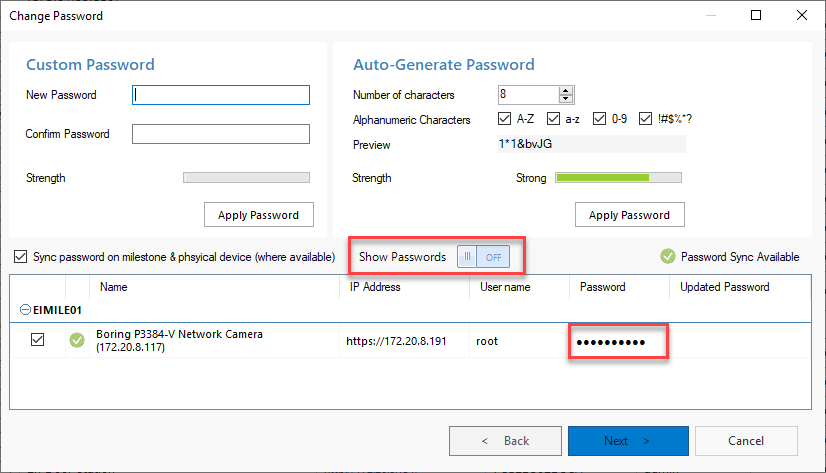
Set current passwords to be hidden by default with a switch to show them if required.
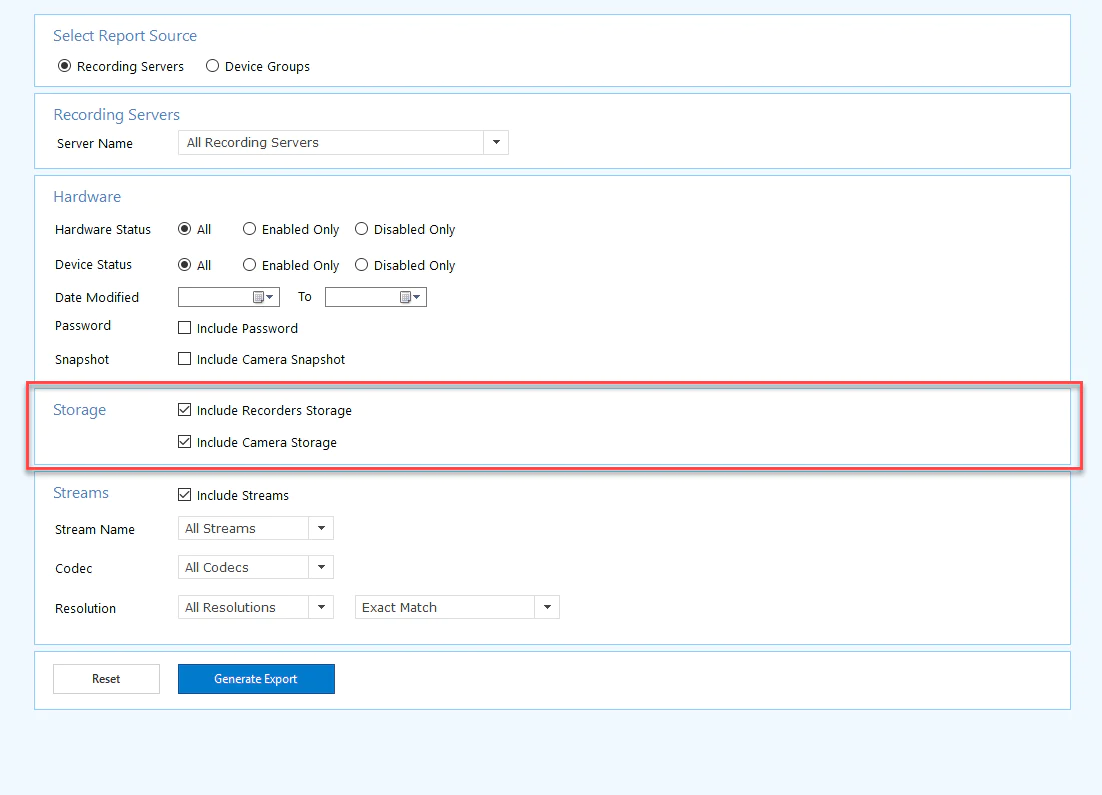
Extended reports to include camera and recording server storage.
Some general improvements to the product.


Your go-to XProtect eXPerts. We learn the technical stuff that will save you time and make it less boring.
Your go-to XProtect eXPerts. We learn the technical stuff that will save you time and make it less boring.
Your cameras can be online, recording, and still produce unusable video. AI Image Analysis adds a new layer of health...

If you're managing a large Milestone XProtect deployment, you already know the routine: camera checks, storage reports, compliance audits, and...
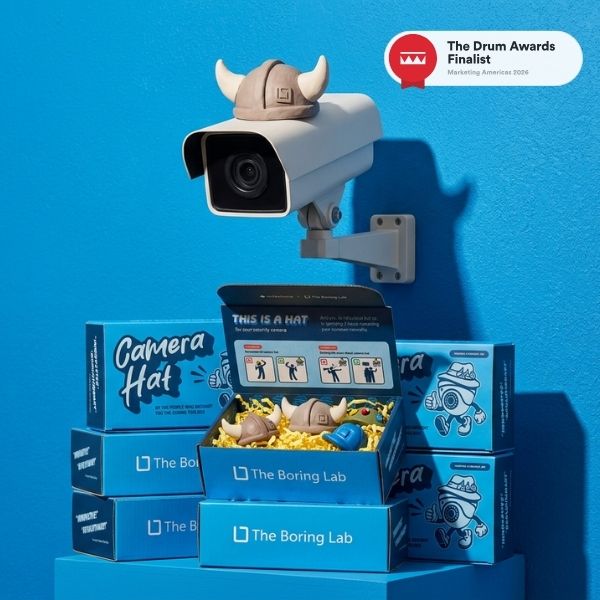
The Boring Lab’s Camera Hat campaign has been shortlisted for the Drum Marketing Awards Americas 2026 in the B2B category....