
Managing over 240 cameras across a growing city isn’t easy—especially when one person is responsible for it all. See how...

Excel reports are great. Everyone loves excel. We have friends that are excel reports. We appreciate how they just tell it how it is; lay the facts out there and let you come to your own conclusions. We’ve always appreciated that about them, real straight-shooters.
But there is something about data insights displayed on a sleek, modern dashboard that gets our blood pumping. Not to mention that the insights you know and love (and then some!) will be available on any computer, using any browser, anytime, anywhere.
Did you hear that? That’s the sound of fewer notifications because your team can check on the health of your cameras and recording servers themselves.
Accessible from any browser, you are able to share important system health information with relevant colleagues, even if they don’t have Milestone or the Boring Client installed on their computer. So now your colleague who refuses to give up their Macbook and the one who can’t read an excel report to save their life, won’t need to! They can simply log in to Boring from their browser and see everything they need to know about how your video security system is functioning.
We just got chills. And we haven’t even told you about all of the cool new insights you can find on your new web dashboard!!!
Buckle up, we’re digging into every feature and showing you every filter, every setting, every insight, pixel by pixel.
The Boring Web Dashboard is our first release in our mission to migrate the Boring Toolbox to a browser-based application.
Security teams are typically small. And they need to be able to easily share data across cross functional teams. Currently, there’s no built in functionality in Milestone to do this.
Milestone users without The Boring Toolbox have no easy way to pull and share information about the health of their system. Their best option for sharing this critical information is to do so by sending screenshots… yikes.
But with The Boring Toolbox, Milestone users can share information about their VMS with their team in a number of ways! Pull a .csv report in seconds using one-click reporting, schedule reports to send on a regular cadence, or give your colleagues their own login to access the health insights themselves from their browser! No software needed!
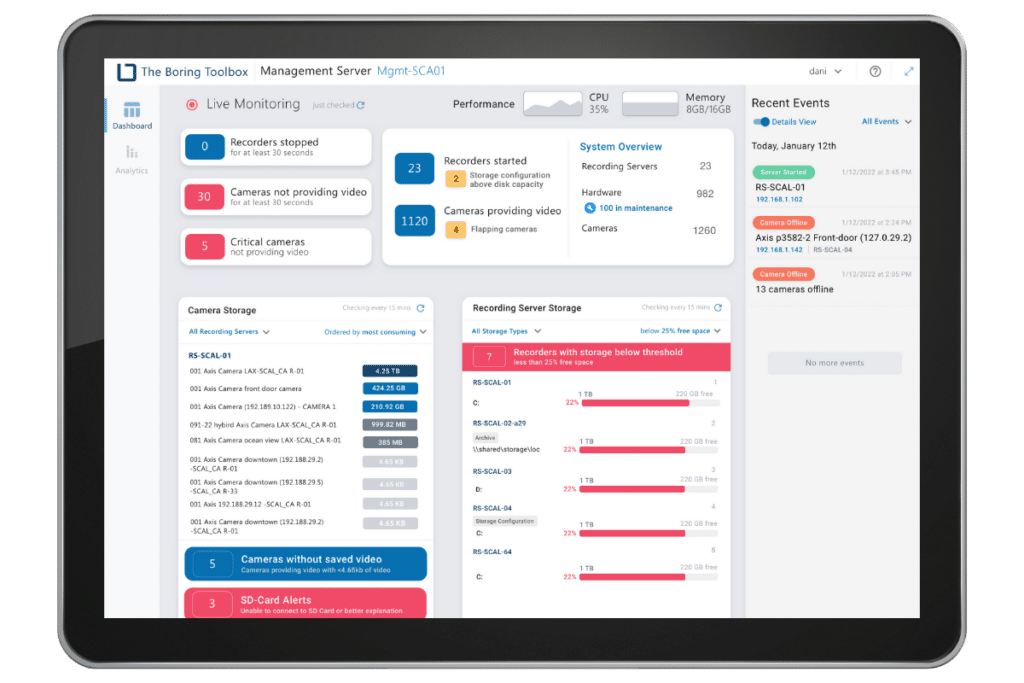
All you need is a chrome browser to login and voila! They can see which cameras need attention, which recording servers are nearly full, and more valuable insights so your team can take action immediately.
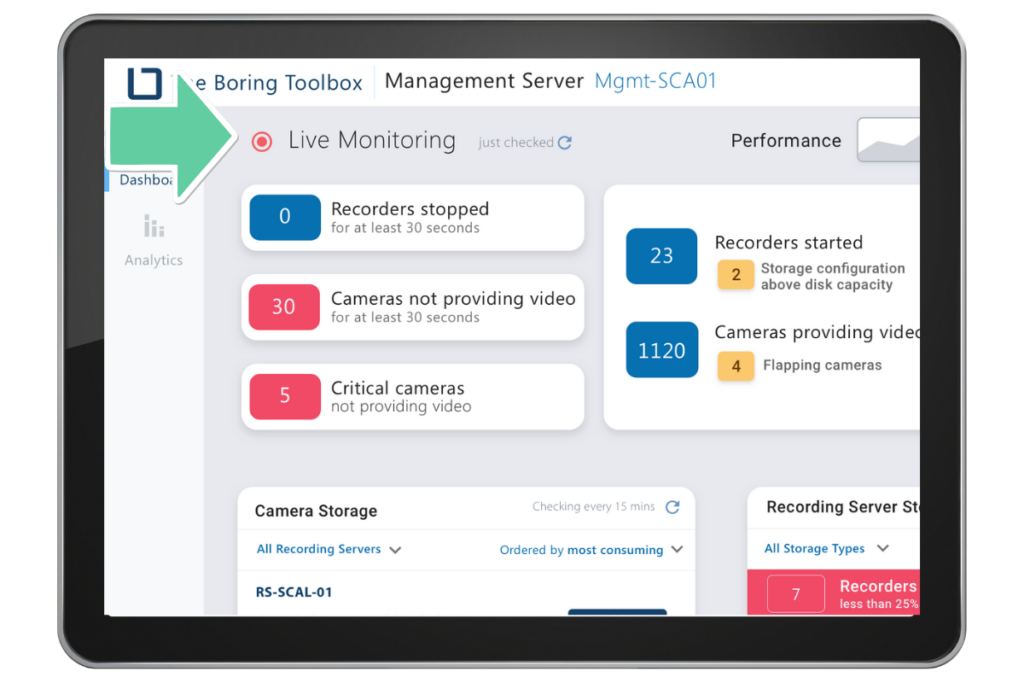
Live Monitoring on the web dashboard has the same functionality you know and love but now has a cool new look.
Live monitoring gives you easy access to real-time insights about the health of your VMS. The section is now in a higher and more prominent location on the interface, giving you more immediate visibility into what is happening with your system.
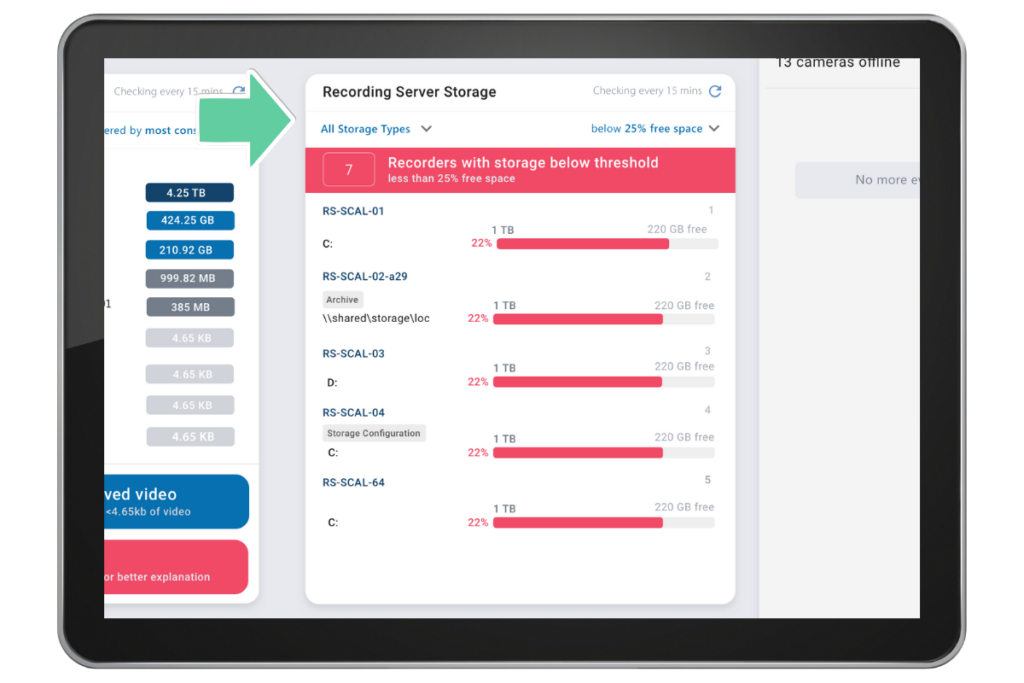
Our recording server storage health quickly identifies only the recording servers that need your attention, but with new functionality.
The web dashboard monitors both XProtect archive configuration as well as physical storage on the servers themselves. In short, you don’t have to worry about losing precious video due to misconfiguration of archive storage in Milestone, and can be proactive about potential issues.
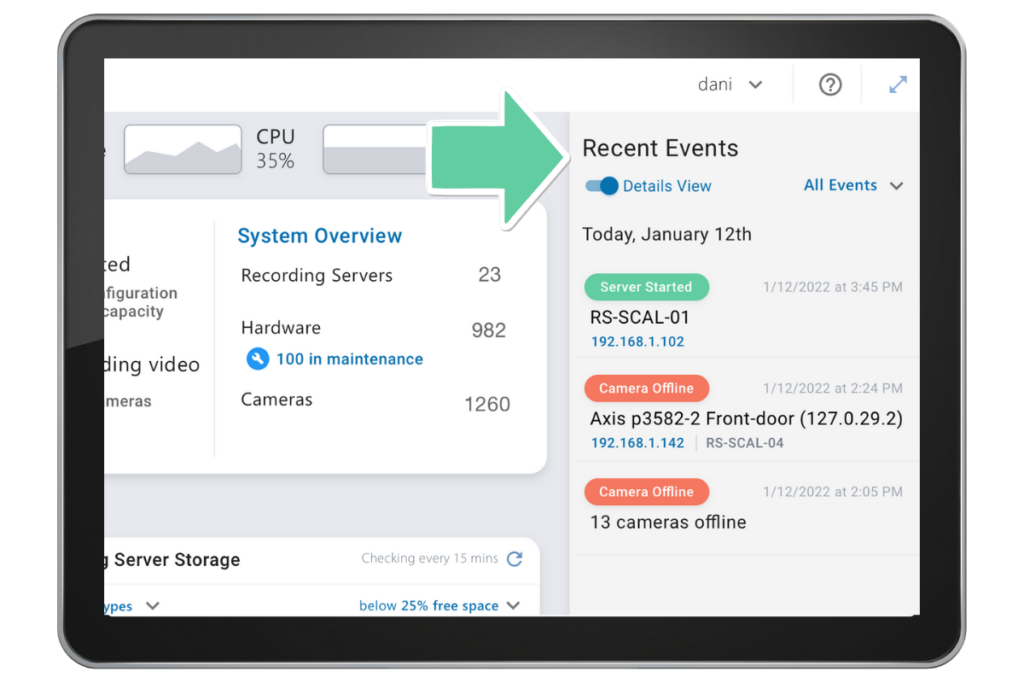
If you haven’t logged into your Milestone VMS or the Boring Toolbox in a while, Recent Events is going to be your new best friend.
The feature appears on the right side of the interface and functions as a timeline of the most pertinent recent events that have occurred in your system while you were away.
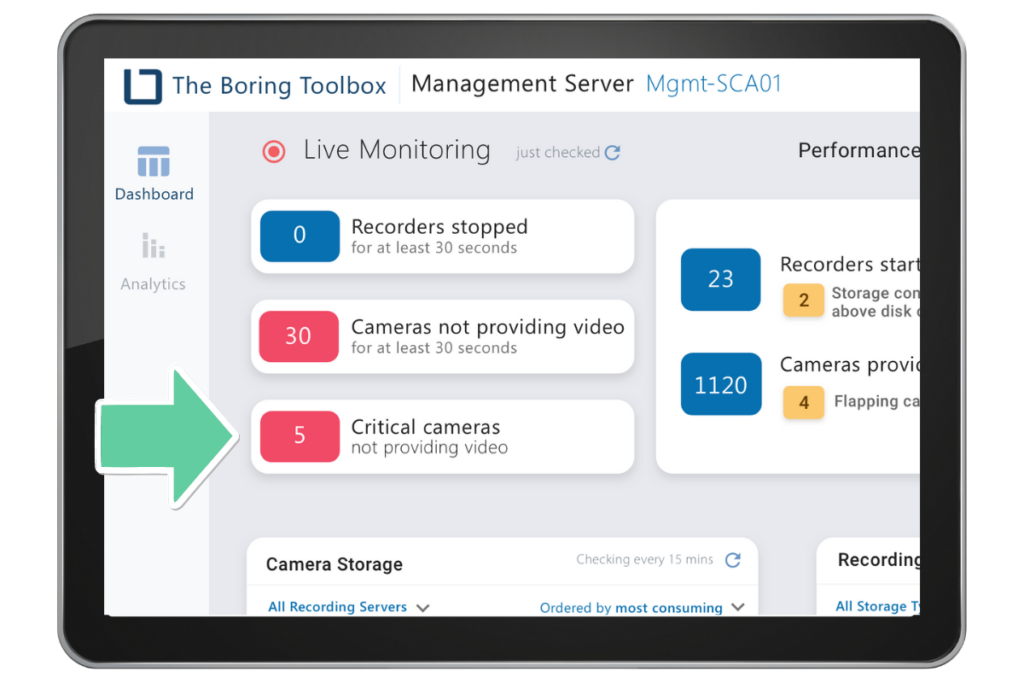
Critical cameras can be found in the Live Monitoring section of the dashboard for immediate visibility when you need it most.
Previously, you could tag cameras as critical but you would have to turn on Critical Camera Mode on the site itself. But once Critical Camera Mode was turned on, The Boring Toolbox would only send notifications when a critical camera stops providing video.
In this new release, the change in notifications (emails) for critical cameras has been made optional. That means you can maintain current notification functionality yet see, on the dashboard, those higher SLA cameras that are having issues and need more immediate attention.
This feature can be life-changing for users that have cameras with differing service-level agreements.
A use case for critical cameras:
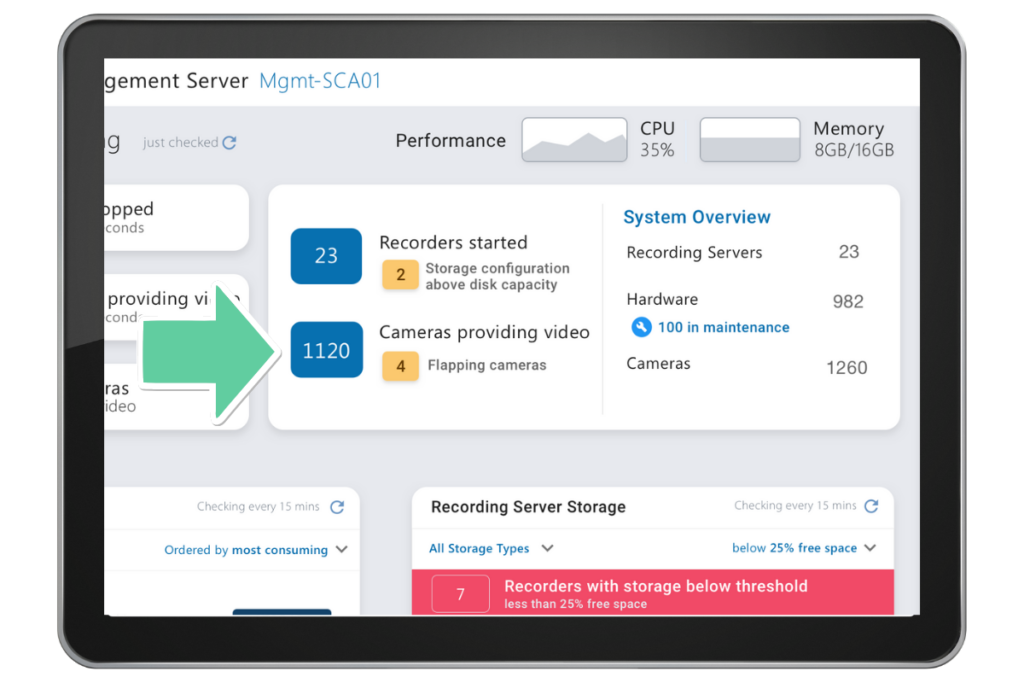
The idea behind flapping cameras was born while spending time supporting some of our clients. When working with them we saw the “cameras providing video” number on the live monitoring tile continuously fluctuate. Investigating this further we found that this behavior was caused by camera hardware or POE issues.
Being notified about recording errors is only really helpful when its a real and relevant issue. We solved the over-notification problem with the introduction of our notification thresholds which allows you to define what constitutes a relevant issue.
But what about the cameras that experience multiple down events within that threshold period? Great point, thanks for asking. Occasionally these temperamental cameras can fly under the radar without triggering a notification.
We call these ‘flapping cameras.’
Our new Flapping Camera module gives you the power to set your own filters on what defines a flapping camera, making it easier to pinpoint any cameras that may be acting abnormally.
For example: “See cameras with a minimum of [3] down events that lasted at least [30] seconds within the last [12] hours.”
The Flapping Camera signal gives you insight into potential problems within your system, allowing you to be even more proactive about the health of your VMS.
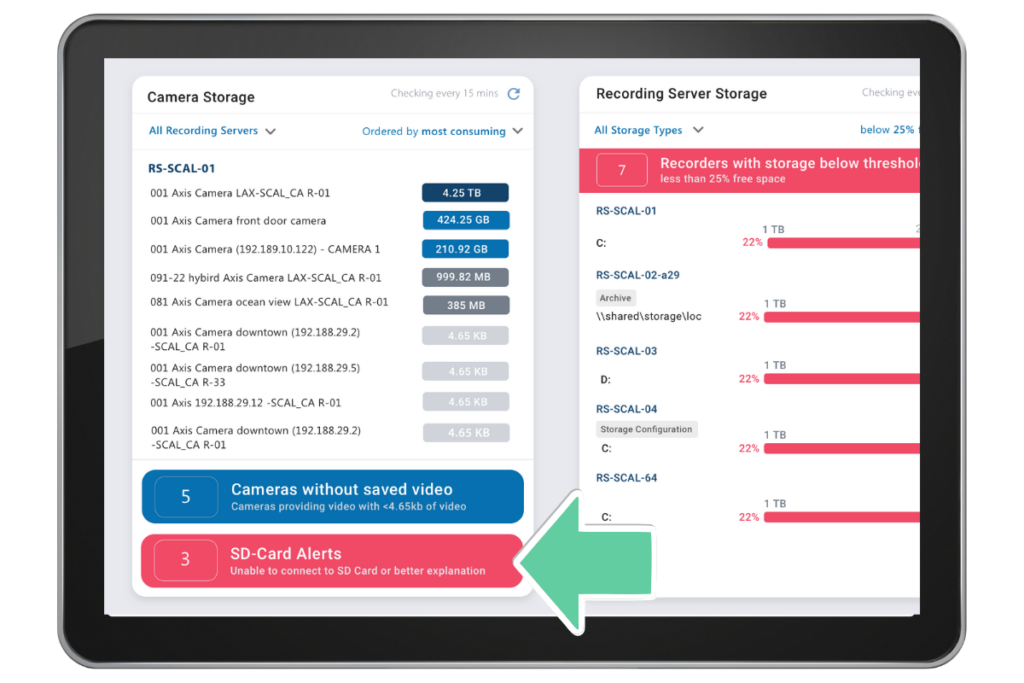
The new SD card health monitoring is really useful for our customers who are using SD cards for edge storage.
Using an SD card can be beneficial in the event that a camera loses connection to the recording server, or if the recording server fails, your footage will be safe, saved on the SD Card.
Using SD cards as a failsafe is a great plan, that is, unless the SD Card is full or any other number of errors has gotten in the way of the recording. To verify the storage capacity of your SD Cards, you’d have to log into each camera manually. Depending on how many cameras you have in your system, that could potentially take a very long time.
Not anymore!
We have partnered with Axis, Hanwaha and Bosch to give you access to SD Card insights directly from your browser. No need to verify each SD Card manually, The Boring Toolbox will tell you which SD Cards need attention.
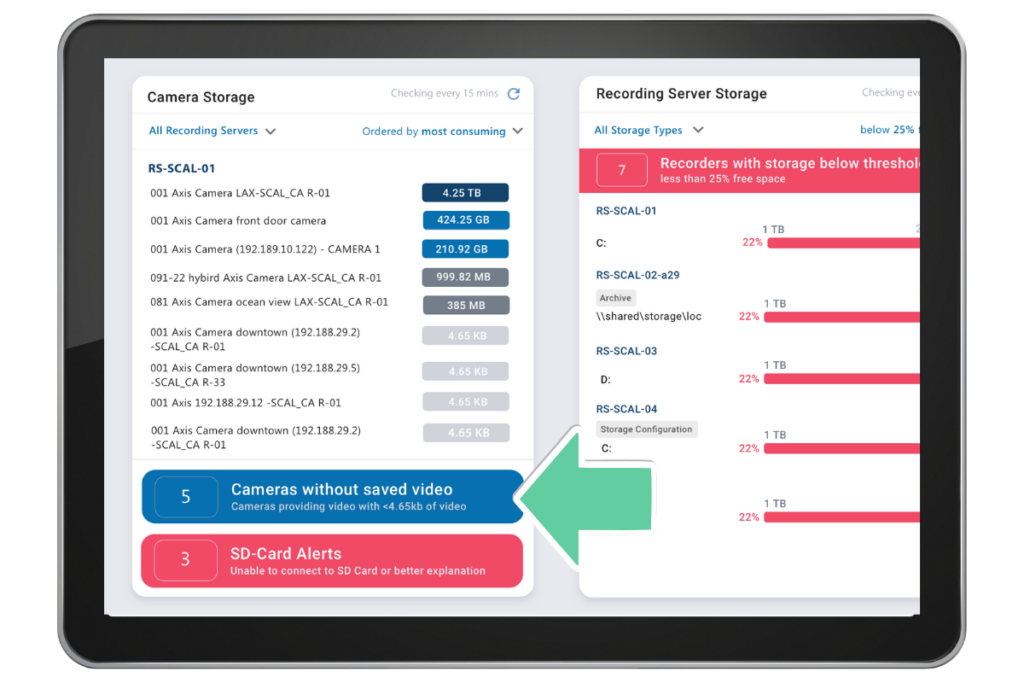
The ‘cameras without saved video’ functionality was built to provide more in depth insights on which cameras in your system may not be recording any video to the disk.
Although some cameras may not be recording by design, calling them out allows admins to have even more visibility into what’s actually happening in their system so they know exactly when and how to take action when things go awry.
All Boring customers with an active Boring Upgrade Subscription (BUS) will have access to all of the features included on our new Boring Browser Dashboard.
Get access today when you upgrade to the latest version of The Boring Toolbox.
Aspiring Boring Toolbox customer?
Try it FOR FREE when you sign up for a 30-day free trial.
By improving the existing features you know and love and adding new functionality, Boring’s Browser Dashboard is the most accessible Milestone VMS health dashboard in the game.
One thing that makes our products unique is that we actively involve our customers in the development process. We are committed to creating solutions to actual problems that our customers experience and finding new ways to innovate their workflows and lighten their workloads.
Many of the features you will see on the browser-based dashboard were inspired by requests we heard in support tickets, demos, conversations, and more. You asked, and we delivered.
The current layout of the platform was also made possible by customer feedback. We went through multiple iterations of the dashboard interface, interviewing customers along the way to find the most intuitive, easy-to-use design.
Here are just a few of the iterations that we went through to get to the final version of our web dashboard:

Your go-to XProtect eXPerts. We learn the technical stuff that will save you time and make it less boring.
Your go-to XProtect eXPerts. We learn the technical stuff that will save you time and make it less boring.
Sign up for a 30 Day Free Trial of The Boring Toolbox and start using our time-saving features today.
Sign up for our [NOT so] Boring Newsletter to get a monthly dose of XProtect tips, security trends, and a touch of humor delivered directly to your inbox.
Managing over 240 cameras across a growing city isn’t easy—especially when one person is responsible for it all. See how...

This step-by-step guide shows you how to access Milestone XProtect from anywhere using Tailscale. It’s secure, simple, and way less...
Our new Identity and Access Management (IAM) platform makes it easy to manage what your users can see and do...

Subscribe to get a monthly dose of security & surveillance industry news and insights, Milestone VMS time-saving tricks, tips for hacking your way out of boring work sent directly to your inbox!